Keep up with your fill
Many county and municipal landfills need a practical way to track how fill is moving over time—airspace used, where material is going, and how compaction or placement shows up on the ground. Spreadsheets and visual estimates only go so far. We fly your working face and active cells on a schedule you choose (for example monthly or quarterly), then compare each capture to the previous visit so change is visible and measurable.
What you get (base deliverable)
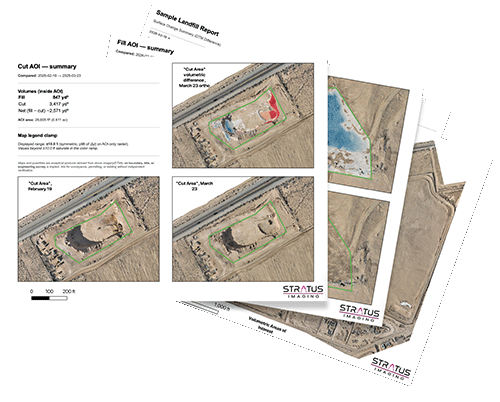
Representative example; layout and detail vary by site.
The standard product is a PDF report built for managers and staff who want answers in one place:
- Cover / summary: site-wide change estimates in cubic yards—total volume change since the last flight, plus per-area changes for zones we define with you (cells, phases, or areas of interest).
- Following pages: current and/or comparison orthomosaics, change heatmaps that highlight where the surface moved, and detail for each area of interest (the same subsets summarized on the cover, with supporting visuals).
Managers who have seen this format have told us it is exactly what they were looking for—clear, repeatable, and easy to share internally.
Optional add-on
Interactive 3D viewing in the browser (hosted viewer links) is available for an additional fee if you want stakeholders to explore the surface online. Most programs we work with lead with the PDF; we can scope interactive access when you are ready.
How visits work
We coordinate a safe flight plan with your team, operate on a cadence that fits your budget and reporting cycle, and process photogrammetry so each delivery compares to the prior capture. That comparison drives the cut/fill-style summary and heatmaps—not a one-off map, but change over time at your landfill.
Accuracy & ground control
We match the approach to the accuracy you need:
- RTK workflow: can be supported with a single undisturbed control point (stake or monument) that stays in place between visits.
- Higher accuracy: we can use five ground control points, well distributed around the site, that remain undisturbed between flights so each re-flight ties to the same frame.
We will align on control layout, safety rules, and coordinate system before the first production flight.